
Digital intake, AI charting, RCM automation, and scheduling that lower labor, denials, and supply waste in urgent care.
If I want to cut overhead in urgent care, I’d start with software that removes repeat manual work. In most centers, monthly costs run about $60,000 to $100,000, and payroll alone can take 50% to 70% of that. The biggest cost pressure usually shows up in intake, charting, billing, staffing, supplies, and reporting.
Here’s the short version:
A few numbers stand out:
If I were sizing up software ROI, I’d track these first: cost per visit, admin hours per 100 visits, denial rate, days in A/R, overtime spend, and monthly supply waste.
| Cost area | Manual work tends to cause | Software helps reduce |
|---|---|---|
| Front desk | More typing, paper forms, repeat entry | Check-in time and admin labor |
| Provider charting | Longer note time, more after-hours work | Documentation time per visit |
| Billing | More denials, rework, slower payment | Rework and A/R delays |
| Staffing | Overstaffing or overtime | Labor mismatch by hour/day |
| Supplies | Expired items, overordering, rush orders | Waste and carrying cost |
| Reporting | Spreadsheet work, delayed decisions | Time spent pulling data |
For me, the main takeaway is simple: the first dollars saved usually come from intake and charting, then billing, then staffing and supply control.
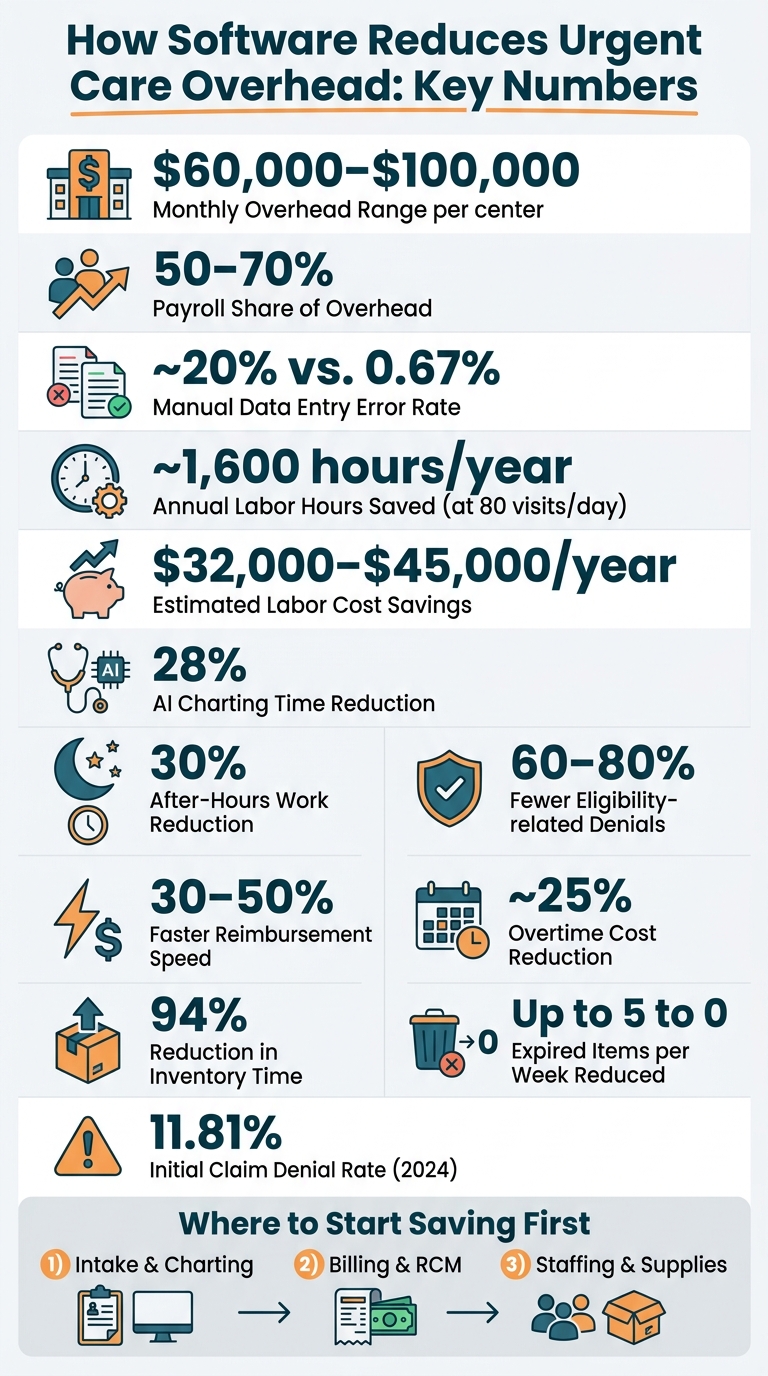
Urgent Care Software ROI: Key Stats & Savings at a Glance
Digital intake and AI charting target the two biggest labor drains in urgent care: check-in and documentation. The biggest gains usually come from two shifts: moving intake before the visit and drafting notes during the visit.
Manual data entry has an error rate of about 20%, compared with 0.67% for digital forms. That gap matters. Every typo in insurance, demographics, or medical history can lead to delays, extra staff work, and claim issues later.
One urban clinic seeing 200+ patients per day reported a 40% decrease in wait times and a 30% reduction in front-desk administrative tasks after switching to digital intake forms.
Ottehr supports this with electronic paperwork, "save your spot" scheduling, and a patient portal that pre-fills demographics, insurance, and history for returning patients. If pre-registration is done ahead of time, the data goes straight into the patient record instead of being typed again at the front desk.
The labor math adds up fast. At 80 visits per day, saving 4 minutes per visit comes out to about 1,600 hours per year, or roughly $32,000–$45,000 in labor capacity based on a fully loaded hourly cost of $20–$28.
Once intake goes digital, the next big source of labor savings comes from faster note creation.
AI ambient scribes capture the visit and draft structured notes for provider review. These tools have reduced documentation time during the shift by 28%. In one quality improvement study, they also reduced after-hours work time by 30% per workday and increased notes closed the same day from 66.2% to 72.4%.
Ottehr includes an AI HPI chatbot that gathers the history of present illness from the patient before the provider enters the room, plus an AI ambient scribe that turns the visit conversation into structured notes. In plain terms, providers spend less time typing and more time reviewing, which can cut down on after-hours charting.
That said, providers still need to review AI-generated notes before sign-off, especially for complex visits.
| Workflow Area | Manual Process | Digital + AI-Assisted |
|---|---|---|
| Check-in time per patient | ~8 minutes | ~3 minutes |
| Registration error rate | ~20% | ~0.67% |
| Note completion time | End of shift or after hours | ~20.4% less time in notes per appointment, with better same-day closure |
| Estimated annual labor impact | Baseline | ~$32,000–$45,000 in redeployable front-desk capacity at 80 visits/day |
Once intake and charting go digital, billing usually becomes the next big source of avoidable overhead. And it adds up fast. Eligibility mistakes, coding errors, and denials all lead to rework, which means more staff time, slower payment, and more friction across the whole revenue cycle.
The initial claim denial rate hit 11.81% in 2024, up from 11.4% in 2023. That's why billing automation is one of the fastest ways to lower operating costs without hiring more staff.
Eligibility problems like the wrong payer, an inactive policy, or an incorrect member ID make up about 10–20% of initial claim denials, and most of those issues can be avoided. Automated real-time eligibility verification catches them at scheduling or pre-registration, before the patient is even seen.
Clinics that use automated eligibility tools report:
Automated claim scrubbers help on the coding side too. They flag code mismatches, missing modifiers, and NCCI edit conflicts before a claim is sent out. That's a big shift. Instead of finding errors after a denial comes back, teams can stop bad claims before submission. The result is lower collection cost and fewer staff hours needed per 1,000 claims.
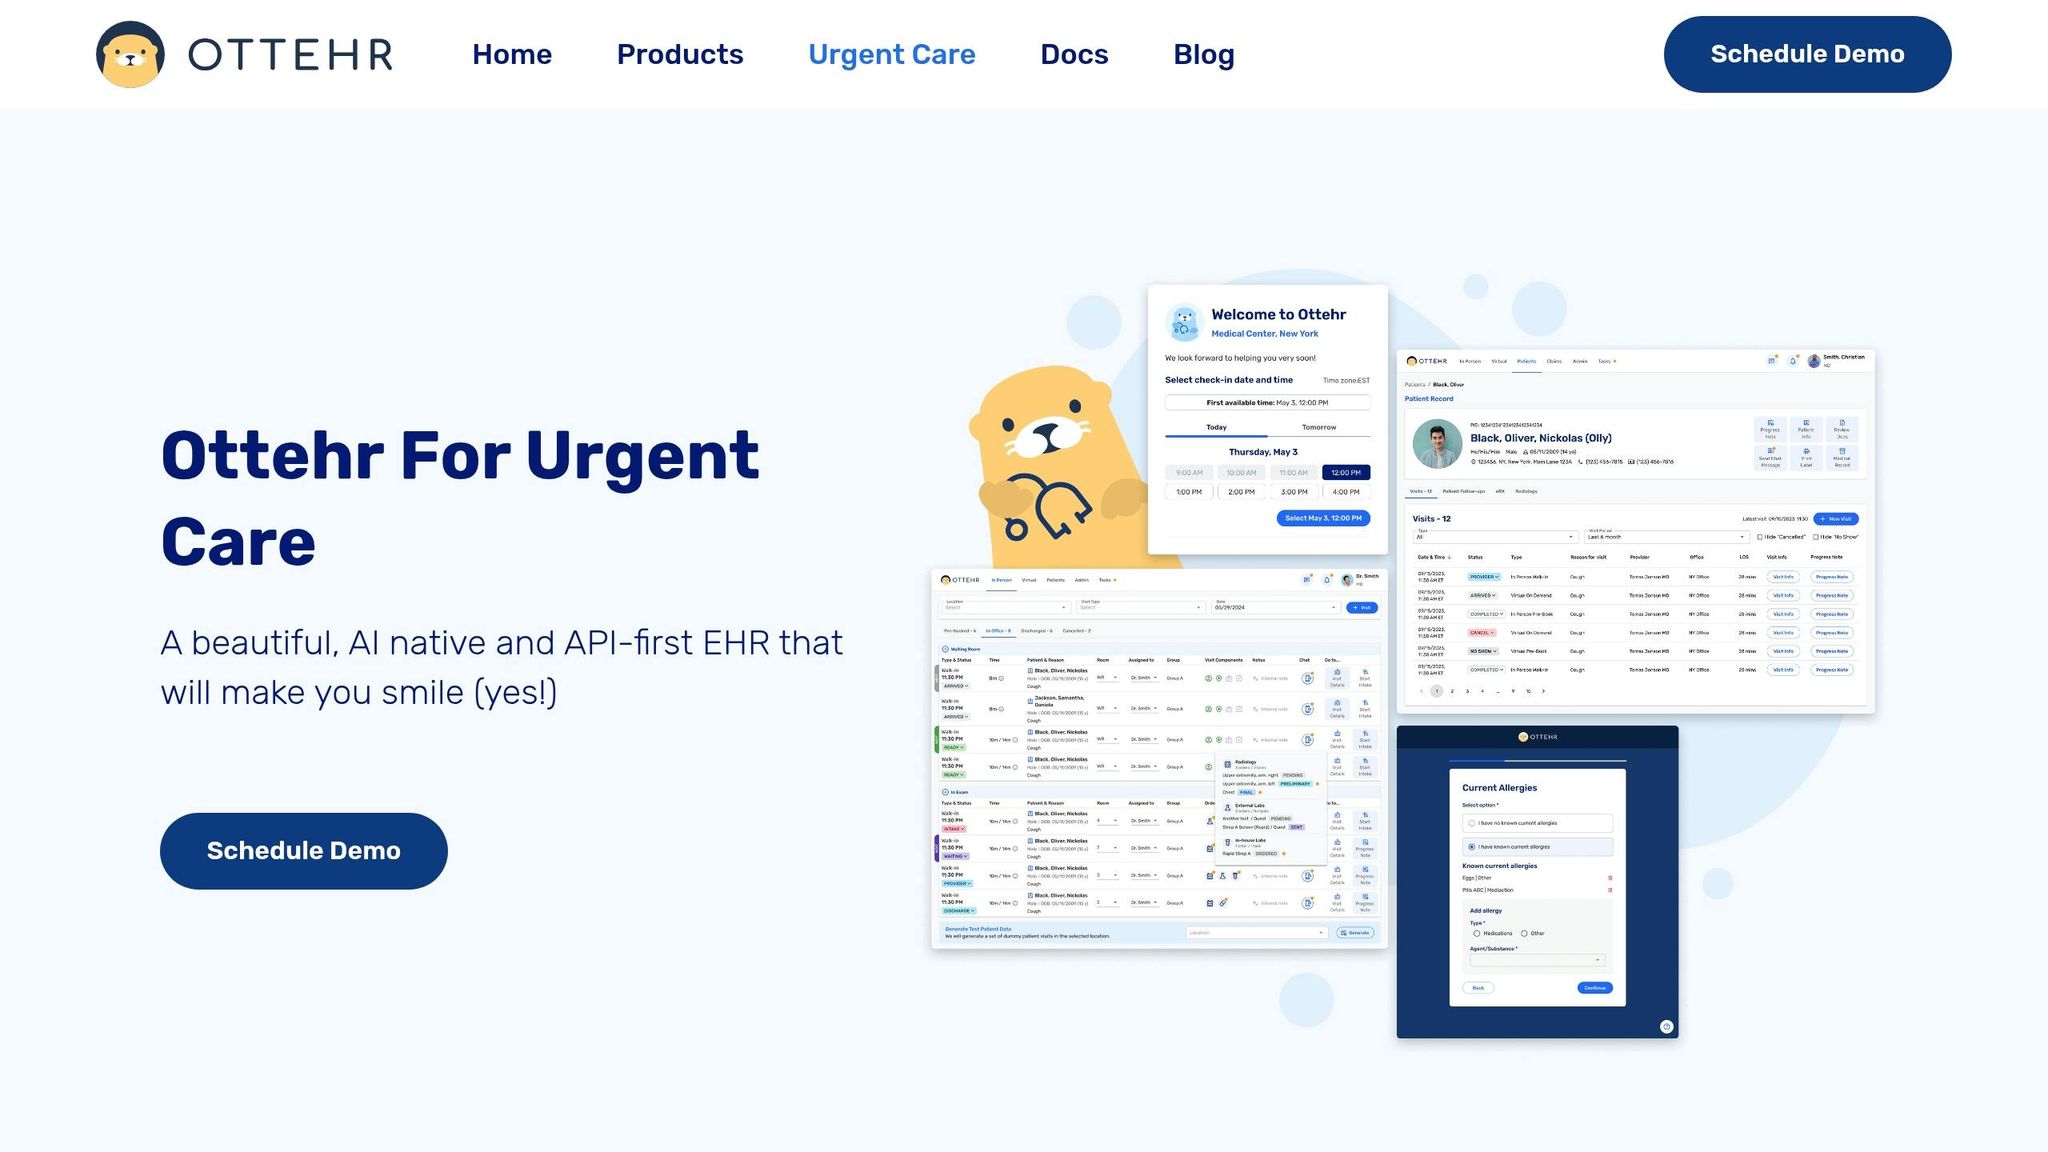
When clinical and billing workflows are connected, fewer things fall through the cracks. Ottehr is built so clinical documentation and billing move through one connected workflow instead of bouncing between separate handoffs. When a provider finishes a note, the AI coding assistant checks codes against payer rules and NCCI edits, then holds flagged claims for manual review before submission.
Ottehr's billing tiers include claims submission, denial management, clearinghouse integration, and patient billing and receivables management, plus options for custom billing rules and enhanced reporting.
You can see that shift in the day-to-day work of a billing team.
| Billing Area | Manual Process | Integrated RCM Automation |
|---|---|---|
| Denial rate | Higher initial denial rates driven by preventable front-end and coding errors | Targets a 50%+ reduction in denial rate within 12 months |
| Staff hours per 1,000 claims | High; eligibility checks, coding review, and rework are handled manually | Reduced; automation handles routine verification and scrubbing, leaving staff to manage exceptions |
| Average rework cost per claim | Higher; each denial triggers correction, resubmission, and payer follow-up | Lower; fewer denials mean fewer touches per claim |
| Days in A/R | Longer; rework and resubmission cycles delay payment | Shorter; clean claims move through faster with fewer resubmission cycles |
| Collection impact | More rework and slower cash flow | Better first-pass acceptance and structured denial follow-up |
RCM automation doesn't replace billing staff. It changes where their time goes. Instead of spending hours on repetitive data entry and avoidable rework, teams can focus on exception handling and denial appeals that need human judgment. That's where software cuts overhead most: by removing the manual touchpoints that create the extra work in the first place.
After intake, charting, and billing, the next place clinics save money is in staffing, supplies, and reporting. When managers lean on manual schedules, paper counts, and spreadsheets, little problems stack up fast. That usually means more overtime, more waste, and slower decisions.
Static schedules rarely line up with what a clinic day actually looks like. They miss busy hours and can leave teams either stretched thin or overstaffed. Workforce management tools use past visit data to build staffing templates around actual demand patterns instead of guesswork. AI-enabled forecasting then updates those staffing suggestions based on seasonal trends, day-of-week patterns, and provider availability.
That matters because managers can spot trouble before it turns into payroll creep. Real-time dashboards flag overtime risk before a shift ends, which gives leaders time to step in and make a change. In plain terms, demand-based scheduling and overtime alerts help keep staffing tied to visit volume.
The same data-first approach works for supplies too.
Small inventory mistakes don't stay small for long. Over a year, they turn into stockouts, rush orders, expired products, and money sitting on shelves. Inventory management software tracks on-hand quantities, usage rates, expiration dates, and reorder points for each item in the clinic.
Instead of relying on manual counts or end-of-month audits, staff get automated alerts when stock falls below a set threshold or when products are getting close to expiration. That leads to fewer stockouts, fewer rush orders, and less waste from expired items.
One clinic case study reported a 94% reduction in time spent on inventory and order management tasks each month, an 84% reduction in manual labor tied to inventory, and expired products falling from up to 5 per week to 0. That's an important point: the savings came from better inventory data, not from using fewer supplies.
| Area | Manual Process | Software-Driven Process |
|---|---|---|
| Scheduling time | High; managers build and adjust schedules manually, often reactively | Lower; demand-based templates reduce build time and ad hoc changes |
| Overtime spend | Higher; static schedules miss peaks, triggering unplanned overtime | Reduced; AI forecasting and real-time alerts help control overtime |
| Expired supply rate | Higher; manual counts may miss expirations until products are already wasted | Lower; automated expiration tracking and alerts reduce waste |
| Inventory carrying cost | Elevated by overordering and slow-moving stock | Lower; data-driven par levels and reorder points reduce excess stock |
| Reporting time | Days; managers pull data from separate systems manually | Hours or less; centralized dashboards surface staffing and supply data in near real time |
Reported implementations show the same pattern. Demand forecasting tools have cut overtime by an average of 25% and temporary labor costs by 15%. Put simply, these tools trim overhead by taking manual work out of the process - the kind of work that leads to overtime, waste, and reporting delays.
The next step is figuring out which of these savings shows up first in labor, waste, and reporting time.
Once you’ve automated the biggest workflows, the next step is simple: figure out where each software dollar saves the most money.
Not every clinic runs into the same problems. Before you pick any software, look back at the last 3 to 6 months of data for the metrics that matter most:
If those costs are climbing faster than visit volume, that’s your bottleneck.
Then match the problem to the tool. Heavy front-desk workload and long check-in lines usually point to digital intake and self-service registration. If providers are finishing charts after hours, AI-assisted charting and urgent care workflow templates go straight at the documentation burden. If denial-related rework and slow collections are causing the biggest drag, integrated RCM can cut manual billing work and clean up claims before submission.
The key is to rank each option by dollar impact, whether that’s labor, revenue leakage, or waste, and start with the costliest problem first.
Use the baseline you captured before launch. The most useful metrics to track are front-desk minutes per visit, note completion time, denial rate, days in A/R, labor cost per visit, overtime hours, and monthly inventory loss. Compare post-go-live numbers against that baseline using similar visit volume ranges.
After go-live, track the same bottlenecks that drove the buying decision in the first place. At 30 days, focus on process changes. Are check-in times dropping? Are charts closing faster? Is the denial rate starting to move?
At 90 days, shift to labor and financial results. Look at labor cost per visit, overtime hours, and A/R aging.
At 180 days, step back and review the full picture: sustained denial reduction, total overtime savings, and whether inventory write-offs are trending down.
| Review Window | Focus Area | Key Metrics |
|---|---|---|
| 30 days | Process adoption | Front-desk minutes per visit, note completion time, initial denial rate |
| 90 days | Financial and labor impact | Labor cost per visit, overtime hours, days in A/R |
| 180 days | Full ROI and trend lines | Sustained denial rate, total inventory loss, staff redeployment |
The fastest way to cut overhead is to solve the costliest bottleneck first, then measure results against your baseline. Software cuts the manual work that pushes overhead higher, and the right metrics show exactly where the savings show up.
An urgent care center should start with an AI-powered EHR that also connects patient intake and revenue cycle management.
A platform like Ottehr gives you one shared digital base. It can automate insurance eligibility checks, digital registration, and claim scrubbing. That means fewer manual entry mistakes, a smoother patient journey, and lower admin labor and overhead costs.
Urgent care clinics may see ROI within the first year after adopting specialized software. One case showed 667% ROI in the first 12 months from AI-driven claims processing.
Where do those returns come from? Usually from a few clear areas: lower admin labor, fewer billing mistakes, recovered revenue, a 40% drop in claim denials, and faster cash flow.
Track the metrics that tell you whether your admin work, finances, and day-to-day operations are moving in the right direction:

Tell us what you need and we'll get back to you soon.