
Track door-to-door time, provider utilization, clean claim rates, and revenue metrics to improve urgent care efficiency and finances.
Running an urgent care center requires tracking the right metrics to improve efficiency, patient satisfaction, and profitability. Key Performance Indicators (KPIs) provide actionable insights for decision-making. Here's what you need to know:
Modern tools, like AI-powered EHR systems such as Ottehr, simplify KPI tracking by offering real-time data, reducing errors, and optimizing workflows. These systems help clinics monitor and act on metrics like provider utilization, wait times, and claim resolution rates immediately.
Tracking and improving KPIs ensures clinics can deliver better care, reduce wait times, and maintain financial health.
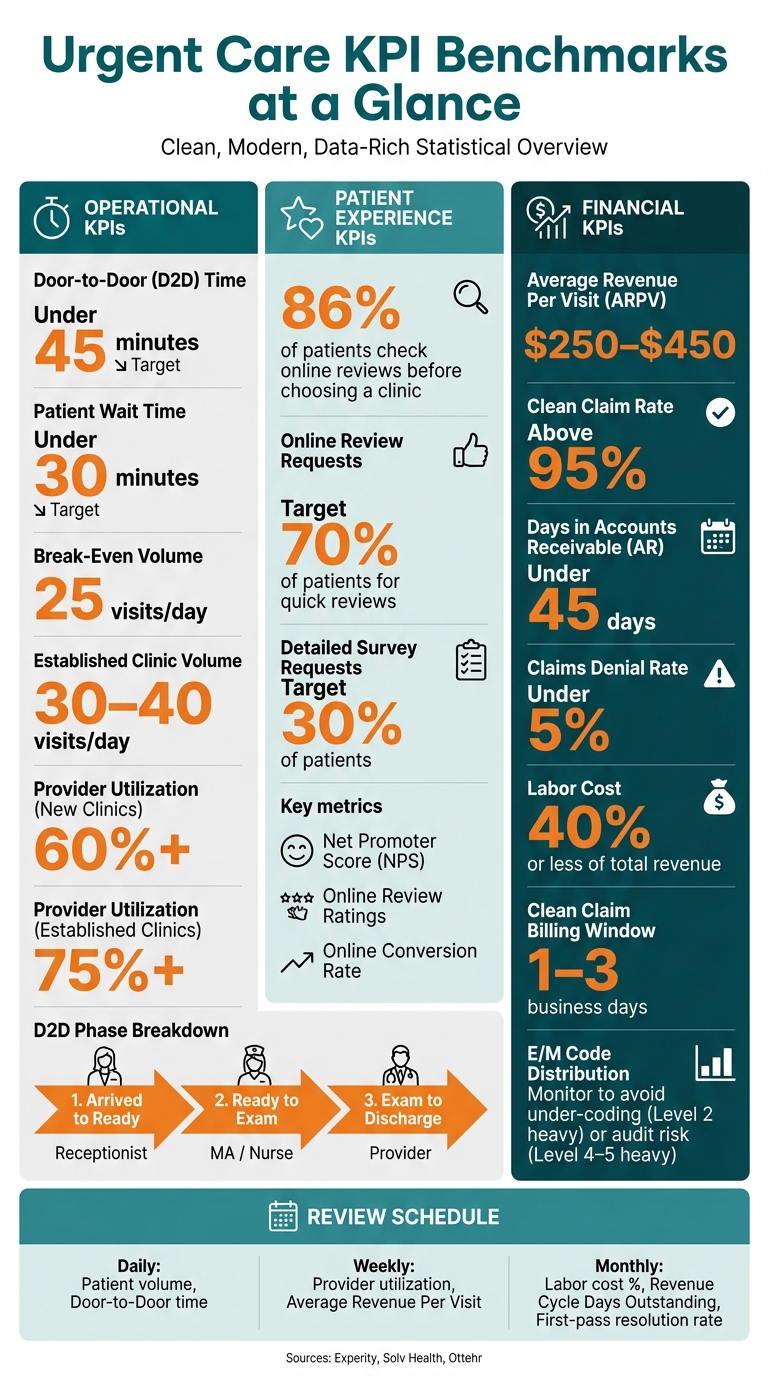
Urgent Care KPI Benchmarks at a Glance
Operational, patient experience, and financial KPIs each offer unique insights into how well your clinic is performing. When combined, they create a well-rounded framework for improving urgent care operations. After all, a clinic might appear profitable on paper but still lose patients due to long wait times or poor experiences.
Operational KPIs focus on how efficiently patients move through your clinic. A primary metric here is Door-to-Door (D2D) time, which measures the total time a patient spends in the facility from arrival to discharge. Breaking this down into three phases makes it easier to pinpoint issues:
Assigning clear responsibilities for each phase helps identify and address bottlenecks quickly.
To break even, a typical urgent care clinic needs about 25 patient visits per day. Well-established clinics, on the other hand, average 30–40 visits daily, with provider utilization rates of 75% or higher to manage overhead costs effectively.
"The goal should be to reduce the amount of hand-offs and physical walking steps it takes to care for the patient." - Solv Health
While operational efficiency is key, understanding how patients perceive their experience offers a deeper look into overall clinic performance.
Patient experience KPIs measure how patients feel about their visit, which directly impacts business success. The most important metrics include:
Encouraging feedback is essential. Aim to request quick online reviews from 70% of patients and more detailed surveys from 30% to ensure a steady flow of actionable insights.
"When patients wait a long time, they are more likely to leave with a perceived negative experience even if they received quality care." - Solv Health
Finally, financial KPIs tie these operational and experiential metrics to your clinic's profitability.
Financial KPIs reveal whether your clinic is profitable - and why it might not be if issues arise. The top metrics to monitor include:
Another critical financial metric is E/M (Evaluation and Management) code distribution. A high number of Level 2 codes could mean under-documentation, while too many Level 4 or 5 codes might trigger payer audits.
To maintain financial stability, aim to keep labor costs at 40% or less of total revenue and limit claims denial rates to under 5%.
"Financial issues when ignored can turn into an emergency." - Experity
To set effective KPI targets, you need context. The best strategy combines your clinic's historical performance with established industry benchmarks, helping you craft goals that are both achievable and impactful.
Start by assessing your clinic's current performance in three key areas: patient volume, operational efficiency, and financial health. Once you have this baseline, compare it against industry benchmarks. For instance:
Assigning specific team members to oversee different KPI areas ensures accountability and helps improve throughput outcomes.
Once benchmarks are set, tracking data immediately is critical for quick adjustments and better decision-making.
Real-time monitoring is where the magic happens. Relying solely on monthly reports can delay problem-solving, but live data offers instant insights. Tools like Ottehr provide real-time visibility into metrics such as patient volume, wait times, and claim status, enabling same-day decisions. For example, if patient volume spikes unexpectedly, you can adjust staffing or workflows right away.
Real-time data also improves capacity management. Imagine one location is falling behind - your team can redirect patients to a nearby clinic with more availability using load balancing. This keeps wait times manageable without the need for additional staff.
Regular reviews turn data into actionable improvements. A structured review schedule might look like this:
| Review Frequency | KPIs to Focus On |
|---|---|
| Daily | Patient volume, Door-to-Door time |
| Weekly | Provider utilization, Average Revenue Per Visit |
| Monthly | Labor cost % of revenue, Revenue Cycle Days Outstanding, First-pass resolution rate |
For example, reviewing provider utilization weekly gives you enough time to adjust schedules for the following week. This proactive approach prevents issues like understaffing or overstaffing from snowballing. The goal is to make small, continuous adjustments rather than waiting for quarterly reviews to reveal larger, more complex problems.
Building on benchmarking and review strategies, these KPIs offer insights to optimize daily operations. Let’s break down the critical metrics driving urgent care performance.
Patient wait time measures how long a patient waits to see a provider, while door-to-door (D2D) time tracks the entire visit from arrival to departure. The goal? Keep wait times under 30 minutes and D2D visits under 45 minutes.
To measure D2D time effectively, divide the visit into three phases and assign responsibility for each:
| D2D Phase Targets | Start Point | End Point | Responsible Role |
|---|---|---|---|
| Arrived to Ready | Patient arrival | Registration complete | Receptionist |
| Ready to Exam | Registration complete | Patient in exam room | MA / Nurse |
| Exam to Discharge | Provider entry | Patient departure | Provider |
Assigning clear accountability for each phase helps identify and address bottlenecks.
Provider utilization tracks the ratio of treatments performed to the maximum treatments scheduled. For newer clinics, aim for at least 60% utilization, while established practices should target 75% or higher. Low utilization suggests unused capacity, while consistently high utilization could lead to staff burnout and impact care quality. Regular reviews help manage workloads and staffing levels effectively.
Financial KPIs are just as important as operational ones. Focus on two key metrics: Average Revenue Per Visit (ARPV) and clean claim rate.
"The general timeframe to bill a clean claim is one to three business days." - Experity
Also, keep an eye on Revenue Cycle Days Outstanding (RCDO), which tracks the average time to collect payments after a visit. A healthy RCDO is 45 days or less. Strategies like collecting co-pays at checkout and verifying insurance upfront can help maintain this target.
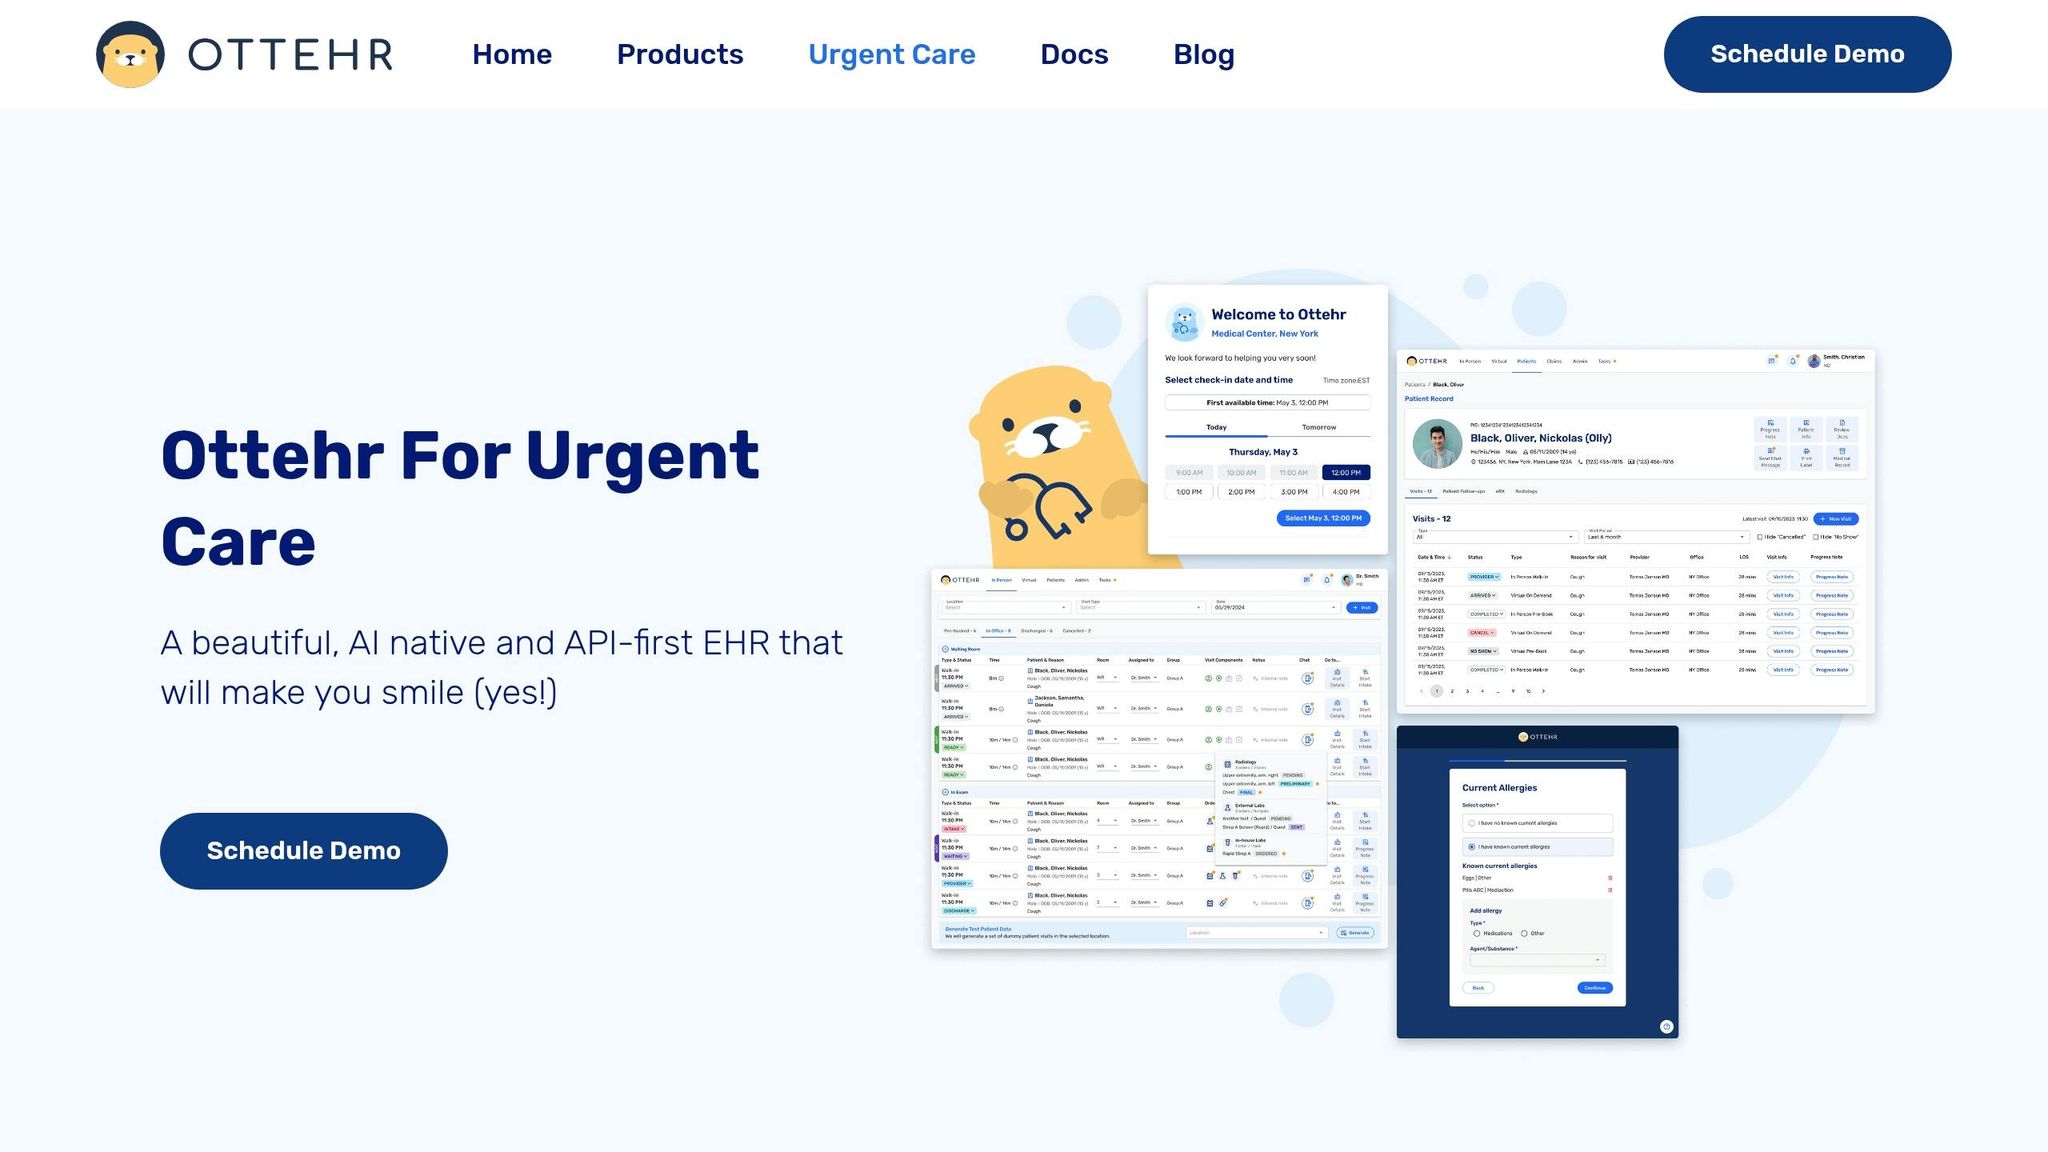
Tracking key performance indicators (KPIs) effectively requires tools that enable swift, informed decision-making. Ottehr is tailored specifically for urgent care, developed by experts in clinical operations, practice management, and billing. Its features are built to address the metrics that matter most in fast-paced, high-volume environments. Having supported over 1 million urgent care visits, Ottehr has proven its value in demanding settings. Here's how its features can directly impact urgent care performance.
Ottehr offers tools like the Visits Tracking Board, Orders Management System, and Tasks Board to provide real-time insights into clinic operations. Its modular design allows for role-specific dashboards, giving team members a clear and focused view of their responsibilities, which simplifies daily workflows.
"Ottehr provides your data team with complete, up-to-date EHR data. Within Ottehr, analytics and dashboards are available for basic reporting and custom reporting is built-in." - Ottehr
For organizations managing multiple sites, Ottehr's dashboards enable seamless comparison of shift-level performance across locations. This makes it easier to spot trends, such as delays in door-to-provider times or inconsistencies in coding practices.
With features like the AI HPI and medical history chatbot, Ottehr gathers patient information before a provider even steps into the room, streamlining workflow and documentation. The AI ambient scribe further reduces documentation burdens, while the coding assistant helps monitor Evaluation and Management (E/M) code distribution to ensure accurate revenue capture.
"Provider charting time is reduced dramatically through AI interviewing and through ambient listening AI scribing." - Ottehr
For instance, providers who frequently code at Level 3 when their documentation supports Level 4 could miss out on 15%–30% of potential revenue per visit. Ottehr's tools help identify and correct these patterns early, delivering measurable financial benefits.
Reliable data capture is critical for accurate KPI tracking. Ottehr's FHIR-native architecture ensures clinical data moves seamlessly between systems, eliminating the need for manual exports or reconciliations. The combination of the ambient scribe and coding assistant ensures documentation is both thorough and accurately coded, which contributes to a clean claims rate exceeding 95%.
Additionally, Ottehr provides organizations with full access to their EHR data at all times. This empowers analytics teams to create custom reports without relying on vendor-generated summaries. Its open-source design also allows for immediate updates and adjustments as your practice evolves.
| Ottehr Tool | KPI It Supports |
|---|---|
| Visits Tracking Board | Door-to-provider time, LWBS rate |
| AI HPI Chatbot | Door-to-provider time |
| AI Ambient Scribe | Provider charting time, staff efficiency |
| AI Coding Assistant | Revenue per visit, clean claim rate |
| Custom Dashboards & Reporting | All KPI categories, multi-site comparison |
Relying solely on a monthly P&L report won't help you identify where time and revenue are slipping away. To effectively manage an urgent care clinic, you need a clear, consolidated view of financial, operational, and patient experience metrics. These metrics should be reviewed regularly and acted upon swiftly. Here are some benchmarks to aim for: door-to-door times under 45 minutes, clean claims billed within 1–3 business days, provider utilization at 75% or higher, and RCDO under 45 days. Clinics meeting these standards are better positioned to scale profitably, compared to those that merely break even at around 25 visits per day.
Another critical, yet frequently overlooked, element is involving your team. Clinics that engage their staff in setting goals and developing KPI strategies often experience more consistent and meaningful performance improvements than those that see metrics as a management-only responsibility.
With these benchmarks in mind, the shift from reactive reporting to proactive management becomes essential.
Now’s the time to take control of your clinic’s performance using the real-time insights and AI-driven tools previously discussed. Forget waiting for end-of-month reports or struggling with manual data pulls - what you need is immediate, actionable visibility. Ottehr’s real-time dashboards, AI-powered documentation tools, and FHIR-native data architecture empower you to catch issues early, whether it’s a dip in first-pass resolution rates, a rise in door-to-provider times, or coding trends impacting revenue.
Ottehr adapts to your practice’s needs. The free Ottehr AI plan includes essential tools like the AI HPI chatbot and ambient scribe, which can start saving charting time immediately. The Ottehr Clinical plan ($349 per provider per month) adds advanced features like an AI coding assistant and radiology integration. For clinics seeking end-to-end revenue cycle management, the Ottehr RCM plan ($599 per provider per month) handles everything from claims submission to denial management and detailed RCM reporting. Starting with these foundational tools can help you improve your clinic’s KPIs right away.
For smaller urgent care centers, it’s critical to focus on metrics that directly influence efficiency, patient satisfaction, and financial stability. Key performance indicators (KPIs) to keep an eye on include patient visit volume and average revenue per encounter. These numbers provide insight into demand, staffing requirements, and overall financial outcomes.
Additionally, keeping tabs on wait times and visit duration can help improve the patient experience, ensuring visitors feel valued and cared for. On the financial side, tracking reimbursement rates and staff utilization is essential for managing costs effectively and maintaining steady revenue flow.
To track door-to-door time with precision, you can rely on integrated urgent care software. These systems automatically record timestamps at every step of a patient's visit - from check-in to discharge. With features like digital check-in, electronic health records (EHR), and workflow automation, the software captures data in real time. This not only removes the need for manual tracking but also delivers accurate insights into patient flow and overall operational performance.
If you're looking to boost clean claim rates and cut down AR (Accounts Receivable) days, refining your revenue cycle management is the way to go. Here are a few key steps to get you there:
By fine-tuning these processes, you can improve cash flow and avoid unnecessary delays in getting paid.
